Fig. 3.
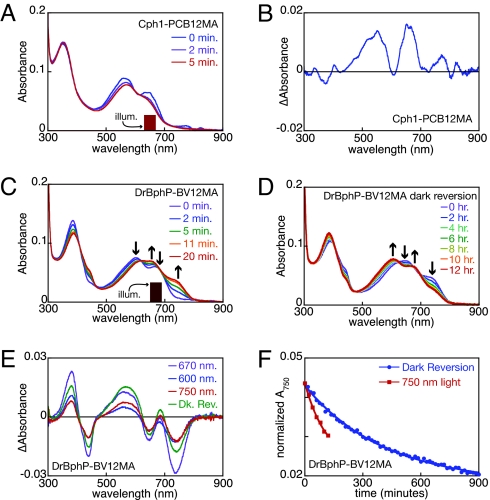
Distinct roles for the 12-propionate in Cph1 and DrBphP photochemistry. (A) Cph1-PCB12MA was illuminated with 650 ± 20 nm light (indicated), and spectra were taken as a function of time. (B) The photochemical difference spectrum is plotted for the data in A. (C) DrBphP-BV12MA was illuminated with 670 ± 20 nm light (indicated) as in A. Arrows indicate peak/trough regions in the difference spectrum. (D) Dark reversion of the dual-Pfr photoequilibrium was examined. Arrows are as in C. (E) Difference spectra are shown for conversion of DrBphP-BV12MA from Pr to Pfr with 670 ± 20 nm light (blue), for subsequent conversion of the same sample with 600 ± 5 nm light (green), for conversion of the 670-nm photoequilibrium mixture with 750 ± 20 nm (red), and for dark reversion of the 600-nm photoequilibrium mixture to the Pfr state (purple). (F) Normalized absorbance at 750 nm is shown for conversion of the dual-Pr/dual-Pfr photoequilibrium mixture of DrBphP-BV12MA to dual-Pr either via dark reversion (blue) or in the presence of 750 ± 20 nm light (red). Illum, illumination.

