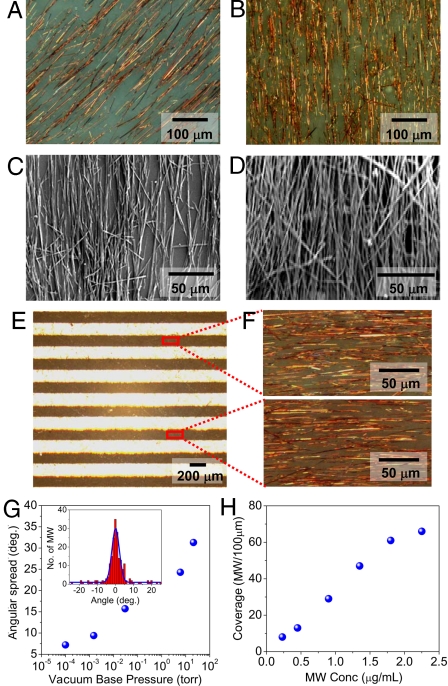
Fig. 4.
Alignment and density control of BPE-PTCDI MWs. (A and B) Bright-field optical images of MW arrays on an AAO membrane after filtration (vacuum pressure 10−4 torr) from different concentrations of MW dispersion: 0.45 μg/mL (A) and 0.9 μg/mL (B) at a constant loading amount (5 mL). (C and D) SEM images of MW arrays transferred onto a wafer. The original MW dispersion had a concentration of 0.9 μg/mL (C) or 1.8 μg/mL (D). The vacuum pressure was kept at 10−4 torr. (E) Bright-field optical image of aligned MWs on an AAO membrane. (F) Zoom-in optical images of MWs in 2 different regions. (G) MW angular spread with respect to the stripe pattern direction versus vacuum pressure. Each data point was obtained by statistical analysis of angular distribution of ≈200 MWs (e.g., see Inset). (Inset) A histogram of MW angular distribution after filtration with a vacuum pressure of 10−4 torr; the blue curve is the Gaussian fitting giving an average angle of 0.1 ± 2.0 degrees with regard to the longitudinal direction of the pattern. The concentration of MW dispersion was 1.4 μg/mL. (H) Coverage of MWs versus MW dispersion concentration at a constant vacuum pressure of 10−4 torr. The average density was evaluated by counting the average number of MWs at any cross-section of the stripe pattern in the range of 100 μm.

