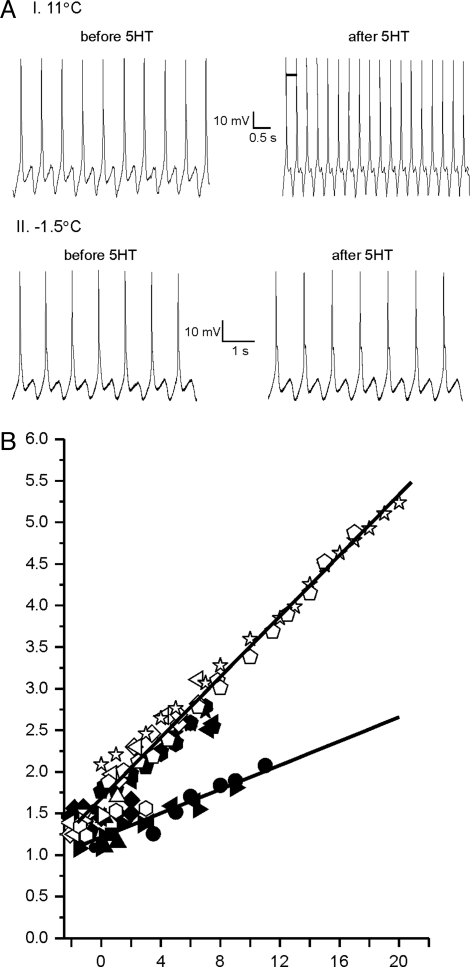
Fig. 3.
Microelectrode recordings from swim motoneurons of C. antarctica. (A) An example of a recording from a swim motoneuron before and after the application of serotonin at 11 °C (I.) and at −1.5 °C (II.). (B) Cumulative temperature vs. swim cycle data. Each shape represents a different swim motoneuron. Filled symbols were measured in filtered seawater, open symbols were measured in filtered seawater with 50 μM serotonin. Lines are linear fits to the slow or fast data.

