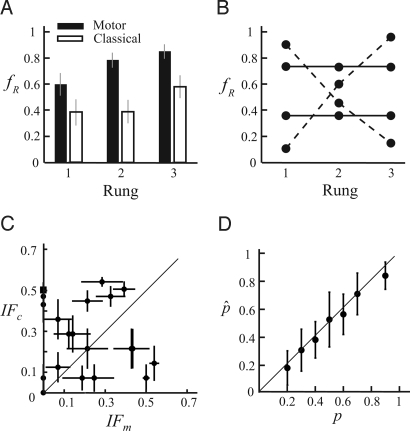
Fig. 2.
Choice data in experiment 1. (A) Mean frequency (collapsed across subjects) of choosing the risky lottery fR was plotted as a function of rung. (B) Hypothetical choice patterns. The solid horizontal lines represent hypothetical patterns of frequencies that do not vary across rungs, consistent with the independence axiom. The dashed lines correspond to patterns of choice that violate the independence axiom. (C) Index of failure. For each subject, we plotted IF of the classical tasks (IFc) against IF of the motor tasks (IFm). IF was computed by taking the standard deviation of fR. The error bars correspond to ±1 SD computed by an application of Efron's bootstrap (27). (D) Averaged verbal estimates on the probability of hit (p̂) were plotted against estimates of probabilities (p) based on subjects' performance during training. The error bars represent ±1 SD of the subjects' verbal estimates.

