Fig. 1.
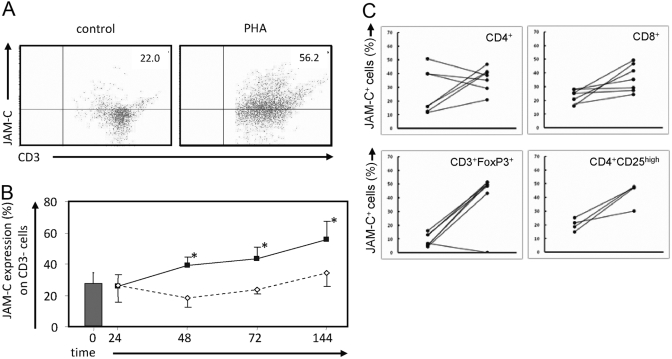
Up-regulation of JAM-C on the cell surface of PHA-activated human T lymphocytes. Human T cells were isolated as described in Materials and Methods and were cultured in the absence or presence of PHA (1 μg/ml) for 48 h. Lymphocytes were analyzed by flow cytometry with FITC-labeled anti-CD3 antibody and allophycocyanin-conjugated JAM-C antibody. Fluorescence-labeled mouse isotypes IgG2b and IgG1 were used as negative controls. (A) One representative from a total of nine independently performed experiments is shown. Numbers in the upper right indicate the percentage of JAM-C+ CD3+ cells. (B) Analysis of JAM-C expression on T cells shows a time dependency. *, P < 0.05, as determined by ANOVA; multiple comparisons were performed using the Bonferroni procedure. □, JAM-C expression under untreated conditions; ▪, JAM-C expression during PHA treatment. (C) Characterization of JAM-C-expressing cells before (left points) and after (right points) PHA stimulation. Isolated JAM-C+ CD8+ or CD4+ cells were stained for the markers indicated. The most pronounced increase in JAM-C expression is observed in cells staining positive for surface markers found on regulatory T cells (Tregs), i.e., CD3+forkhead box P3+ (FoxP3+) and CD4+CD25high. Changes in JAM-C expression (%) on indicated cell types are shown.

