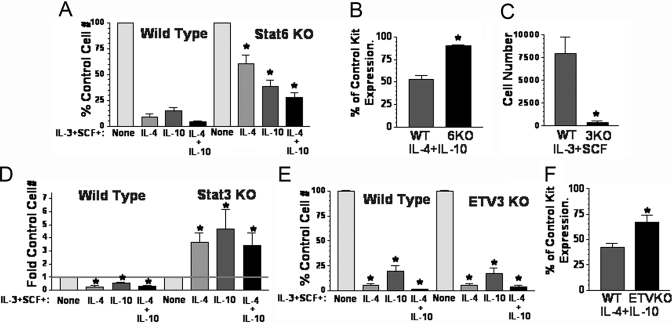
Fig. 7.
The role of Stat6, Stat3, and ETV3 in IL-4 + IL-10-mediated death of developing mast cells. (A) WT and Stat6-deficient (KO) BM cells were cultured for 3 weeks in the indicated conditions, and the change in cell number was determined by timed flow cytometry counting, comparing all values with the IL-3 + SCF control for the indicated genotype. Data are mean and sem from nine samples. *, P < .005, when comparing Stat6 KO with WT cells cultured in the same conditions. (B) WT and Stat6 KO cells were cultured as in A, and Kit expression was assessed on Day 21 by flow cytometry. Percent of Kit expression in IL-3 + SCF cultures was determined from three samples in one of two representative experiments. *, P < .001. (C) WT and Tie2-Cre Stat3 KO BM cells were cultured in IL-3 + SCF for 3 weeks. Data shown are live cell counts from timed flow cytometry analysis using PI-DNA staining. Data are mean and sem of nine samples. *, P < .002. (D) WT and Stat3 KO BM cells were cultured for 3 weeks as in A. Fold change in cell number was determined by timed flow cytometry counting, comparing all values with the IL-3 + SCF control for the indicated genotype. Data are mean and sem from six samples. *, P < .025, when comparing each culture condition with its IL-3 + SCF control group or when comparing WT with Stat3 KO cells. (E) WT and ETV3 KO BM cells were cultured and analyzed for survival as described in A. Data are mean and sem from nine to 10 samples. *, P < .0001, when comparing each culture condition with its IL-3 + SCF control group. (F) The effect of IL-4 + IL-10 on Kit receptor expression was determined using samples from D, harvested on Day 22. Percent of control Kit expression was derived by comparing cells cultured with IL-4 + IL-10 with control cultures from the same genotype. Data shown are from six to 12 samples/point. *, P < .002, when comparing WT and ETV3 KO samples.

