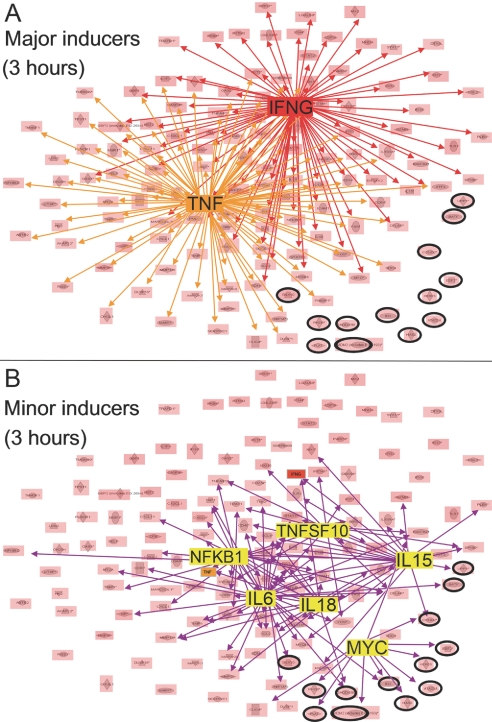
Fig. 2.
Key regulatory networks activated by CpG ODN treatment (3 h time-point). All genes activated at 3 h (P<0.00001), whose regulatory interactions could be mapped by IPA, are shown. (A) Network analysis identifies two major inducers, each up-regulating >50% of all genes: IFNG (red network) and TNF (orange network). Those genes not regulated by IFNG or TNF are circled. (B) Network analysis also identifies minor inducers [IL6, NFKB1, IL15, TNF superfamily (TNFSF)10, MYC, and IL18, purple network] that regulate 10–50% of all genes, including those not regulated by IFNG or TNF.

