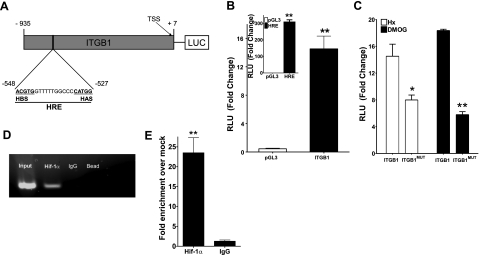
Figure 4.
Isolation, cloning, and functional analysis of the human ITGB1 promoter. A) Construct map of the ITGB1 promoter sequence showing the HRE site relative to the TSS. B) Influence of hypoxia (solid bars) on ITGB1 promoter activity. Inset: HRE and empty PGL3 vector served as positive and negative controls, respectively. C) Influence of site-directed mutagenesis of the HIF binding site on hypoxia (open bars) and DMOG (1 mM)-induced ITGb1 activity. For all experiments, a Renilla plasmid was employed as a cotransfection control. D) ChIP analysis to examine HIF-1α binding to the ITGB1 promoter in hypoxic Caco2 cells. Reaction controls included immunoprecipitations using a nonspecific IgG and beads only, as well as PCR performed using total Caco2 DNA (input). One of three experiments is shown. E) Real-time PCR analysis of ChIP DNA samples. Results were calculated as a fold enrichment over IgG control ± se. Results are derived from three experiments. *P < 0.025, **P < 0.01; Student’s t test.

