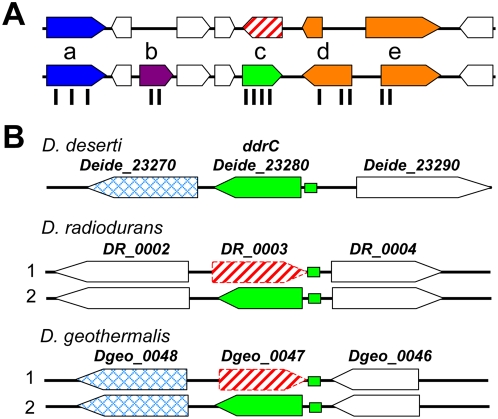
Figure 2. Gene prediction corrections revealed by proteomics and comparative genomics.
(A) Schematic representation of the proteogenomic annotation strategy of D. deserti genome. First, genes were automatically predicted (upper part). Peptides detected by MS, represented by vertical black bars, were then located on the corresponding nucleic acid loci (lower part). Manual validation revealed various cases: (a) validation of predicted genes, (b) detection of non-predicted genes, (c) reversal of gene orientation, and (d, e) correction of start codons. (B) Reversal of ddrC gene orientation in D. radiodurans and D. geothermalis. Several data revealed that the orientation of DR_0003 and Dgeo_0047 (red broken arrows) has to be reversed, resulting in genes highly homologous to correctly predicted Deide_23280 (green arrows). Previous and corrected annotations are labeled 1 and 2, respectively. Green boxes represent the radiation response motif upstream of correct ddrC genes. Flanking genes Deide_23270 and Dgeo_0048 are homologs.

