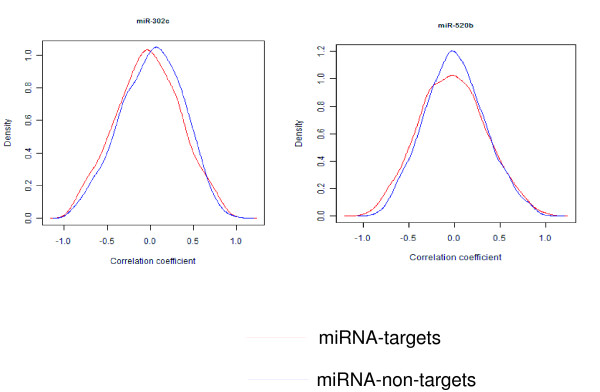
Figure 5.
Correlation coefficients of miRNA-target gene pairs. The expression of miR-302c and miR-502b and their predicted target genes was analyzed by correlation analysis. The distribution of the correlation coefficients for miR-302c-target gene pairs (red line) was shifted toward negative side compared to that of the miR-302c-non-target gene pairs (blue line). The mean of correlation coefficients between the two sets was significantly different (p = 0.0003). The distribution of correlation coefficients for miR-520b-target gene pairs (red line) was also shifted toward negative side compared to the miR-520b-non-target gene pairs (blue line) and the mean of correlation coefficients was significant (p = 0.049).

