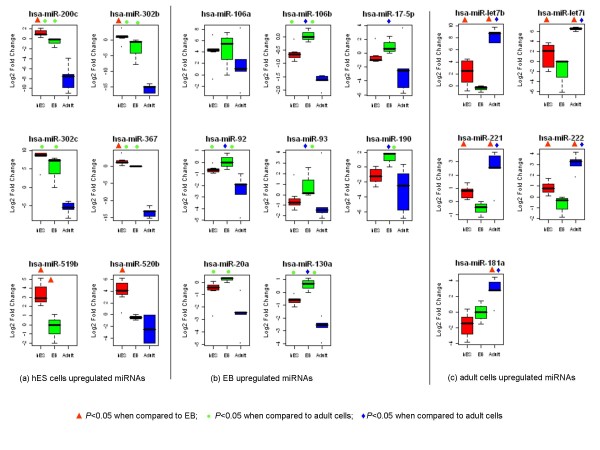
Figure 6.
Measurement of differentially expressed miRNAs by qRT-PCR. The differentially expressed miRNAs were analyzed by qRT-PCR using the relative quantification method. The results were normalized with endogenous control RNU48 and the fold change was calculated by equation2-ΔΔCt. The y-axis indicates the Log2-transformed fold change relative to the calibrator. Expression of levels of miR-200c, miR-302b, miR-302c, miR-367, miR-519b, and miR-520b were the greatest in hES cells (panel A). The expression of miR-106a, miR-106b, miR-17-5p, miR-92, miR-93, miR-190, miR-20a and miR-130 were highest in EB (panel B). Tumor suppressor let-7b/7i, miR-221, miR-222 and miR-181a were expressed at the highest levels in adult cells (panel C). Statistical significance was determined by student t-test. Red triangles indicate a significant difference (P < 0.05) versus EB, green circles indicate a significant difference (P < 0.05) versus adult cells, and blue diamonds indicate a significant difference (P < 0.05) versus hES cells.

