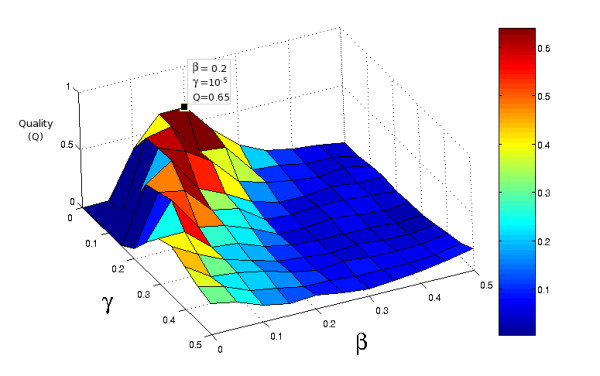
Figure 2.

Prediction quality as a function of β and γ parameters. The prediction quality (Q) for the training (muscle) dataset is plotted here as a function of the β and γ parameters. The maximum value is marked by a square. It should be noted, that the prediction quality seems to be close to zero for most values except for the small area around maximum. Our experiments with wider ranges of parameters (data not shown) also support that hypothesis.
