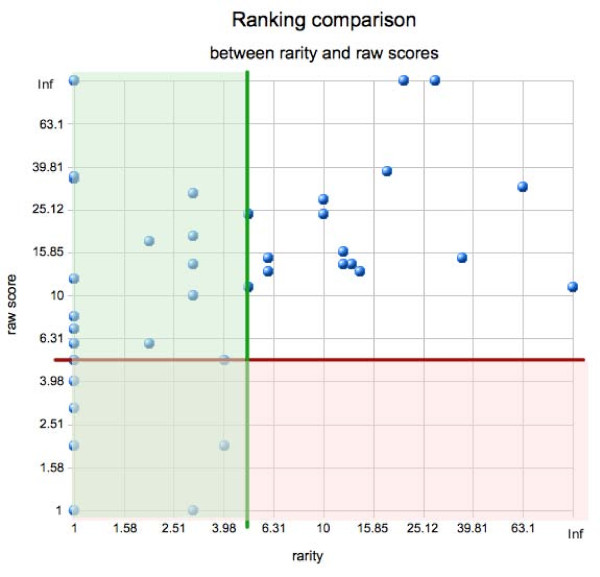
Figure 3.
Comparison of the raw score and the rarity score rankings. The plot shows the comparison of rankings obtained for the CRMs from the training set using raw score vs. rarity scores. Each point corresponds to a single CRM. The position of the dot depends on the ranking of this CRM using raw scores (X-axis, log scale) and its ranking according to the rarity score (Y-axis, log scale). The green and red lines are placed at k = 5 for rarity and raw scores respectively. The points placed below (red shaded area) and left (green shaded area) of these lines are considered to be found by respective methods. As we can see, there are no points found only when using the raw score but substantial number of them is found only when using the rarity score. It should be noted, that the parameter estimation was done for both rankings separately, i.e. optimal parameters β and γ were used for both methods. The data for this table is available in Additional file 1.

