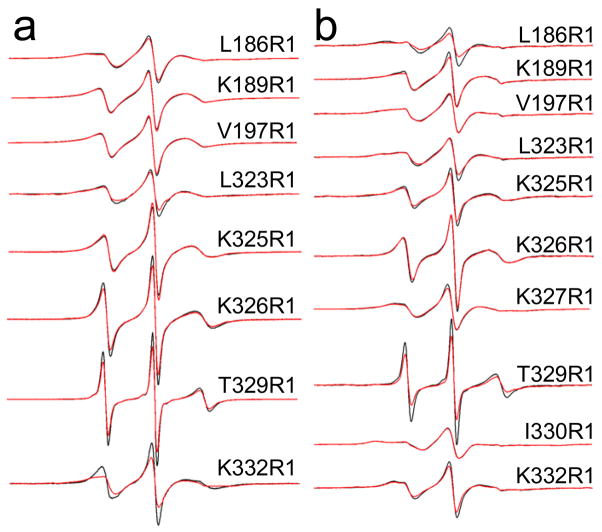
Figure 4.
X-band EPR spectra obtained from single R1 substitutions in the absence of Ca2+ for labeled sites in a) syt1C2A and syt1C2B, and in b) syt1C2AB. Aqueous spectra are shown in black, spectra of R1 mutants in the presence of POPC:POPS lipid vesicles are shown in red. For syt1C2B and syt1C2AB, the protein is completely bound or membrane-associated at the concentrations of lipid used (25 mM). For syt1C2A (sites 186 and 189), sedimentation data (Figure 2) indicate the domain does not bind to POPC:POPS. Spectra are normalized against the total spin number so that the amplitudes provide an approximate measure of the motional averaging of the R1 side-chain. The spectra are all 100 Gauss scans.

