Figure 5.
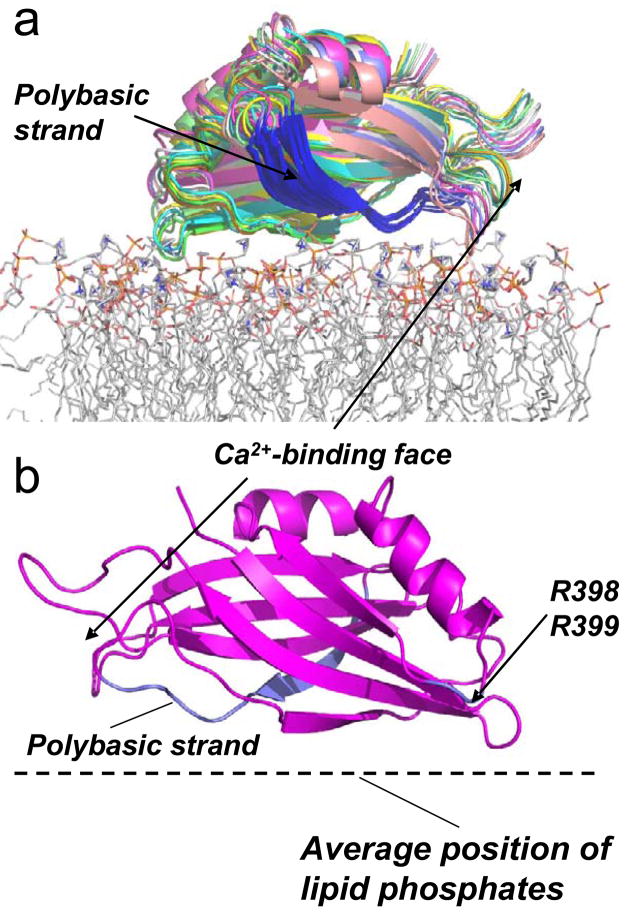
a) The result of simulated annealing showing models for the 10 lowest energy structures for the Ca2+-independent docking of synaptotagmin C2B domain at the membrane interface. The position was generated for C2B using the distance data obtained for syt1C2AB at the POPC:POPS interface (Table 3) and the Xplor-NIH docking routine (see Methods). The membrane associated structure was produced using the PDB structure file for C2B, PDB ID:1K5W. The highly positively charged (polybasic) region of C2B is shown in blue. The protein is shown docked to a POPC bilayer obtained by a molecular dynamics simulation. b) One structure for C2B docked to the membrane interface is shown for clarity. The positively charged clusters that appear to interact electrostatically with the interface are highlighted in blue, and include the polybasic face and the two arginine residues at positions 398 and 399. The protein orientation is rotated 180° on the bilayer surface relative to the orientation shown in A).

