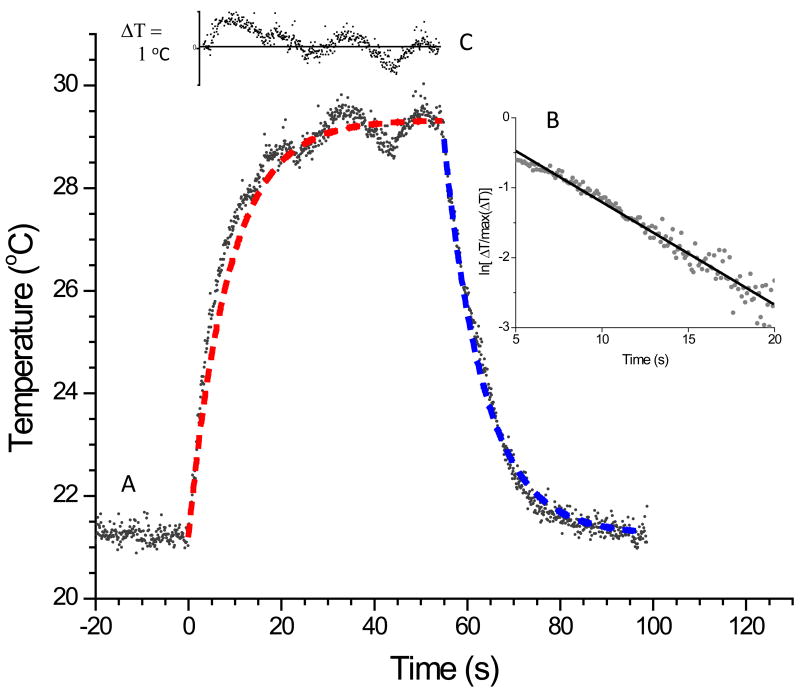
Figure 2.
(A) Typical temperature trace showing increase in temperature after laser excitation (time = 0) and temperature decay back to the ambient after the laser is shut off (~time = 60 seconds). (B) Plot of the natural log of as a function of time right after the laser was turned off. The linear relationship shows that a first order decay is observed for the temperature decay back to the ambient temperature. The blue dash line in the figure is the fit of the data using the decay constant obtained from this plot. The red dash line in the figure is our model fit to the data with η equal to 1. (C) Plot of the residual of the data compared to our model fit.

