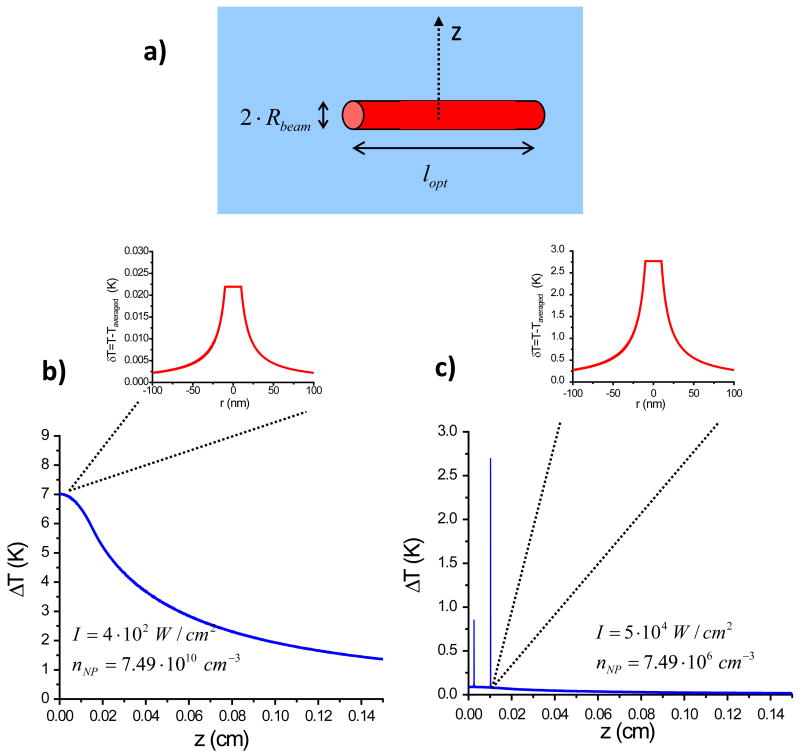
Figure 5.
a) Geometry of the model system with a hot NP cylinder. b) Calculated temperature increase on the mm-scale in the vicinity of the heated cylindrical region. The parameters are similar to those in the experiment. The light power is like in the experiment, moderate; the photon energy is equal to the plasmon peak energy. Here we zoom on a nano-scopic region in the vicinity of a single NP, δT, relative to the local averaged temperate to show a small temperature “bump” of a single NP; I = 4· 102W/cm2, nNP = 7.49 · 1010cm−3. c) The same for the case of a very diluted NP solution and a very high laser power; I = 5 ·104 W/cm2, nNP = 7.49 · 106 cm−3. We see now very sharp “spikes” in the temperature profile due to optically-driven single NPs. Such hot spots can be created and studied using single-NP spectroscopy.10 Again we zoom on a region in the vicinity of a single NP.

