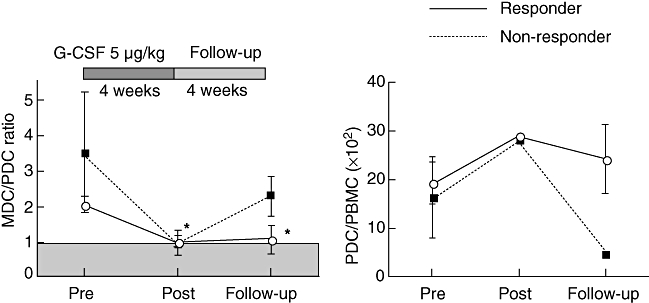
Fig. 3.

Peripheral blood dendritic cell responses to granulocyte-colony stimulating factor (G-CSF) treatment. Myeloid dendritic cells (MDC), lin–DR+CD11c+ and plasmacytoid dendritic cells (PDC), lin–DR+BDCA2+, were measured by flow cytometry before (Pre), at the end (Post), and 4 weeks after (follow-up) G-CSF treatment. The MDC/PDC ratio and PDCs as percentage of total peripheral blood mononuclear cells are shown (mean ± standard error of the mean). *P < 0·01 post-treatment, P < 0·05 at follow-up Responders compared with pretreatment. Responders, solid lines, non-responders, dashed lines.
