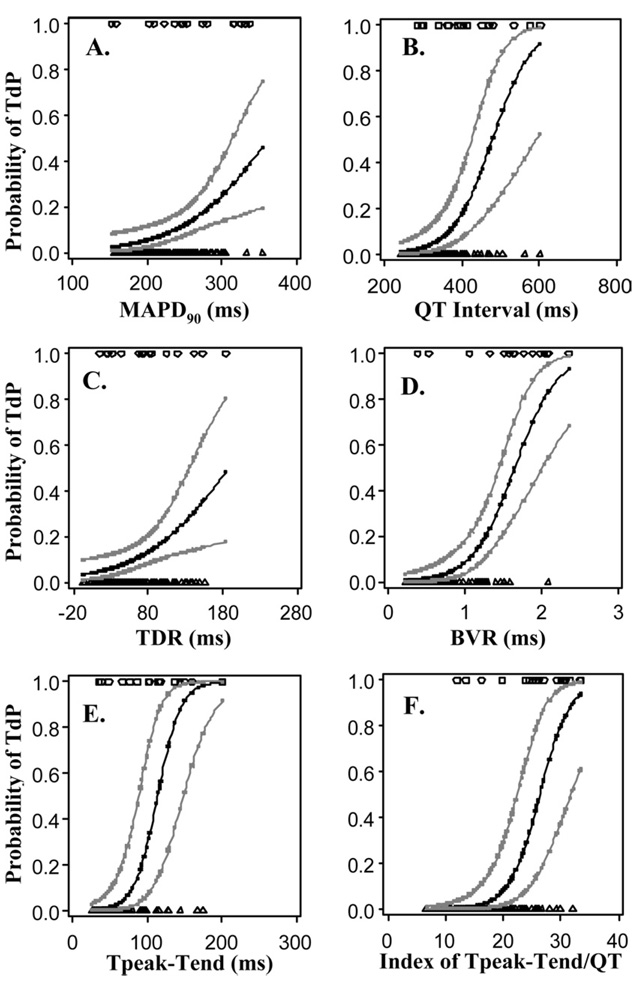
Figure 4.
Relationships between an increase in the value of each of six electrophysiologic parameters and the probability of torsade de pointes (TdP) in a female rabbit isolated heart for all tested conditions (control, quinidine, ATX-II + quinidine). Symbols at the top of each plot indicate individual measured values of a given parameter in a heart with TdP (i.e., observed events). Symbols at the bottom of each figure indicate measured values of the same parameter in a heart without TdP (i.e., observed nonevents). Measured values were fitted using a linear mixed model with a logit link function to determine the predicted probability of TdP at any value of the parameter within the range of values recorded experimentally. The 95% confidence intervals for the predicted probabilities are shown. Abbreviations as in Figure 3.

