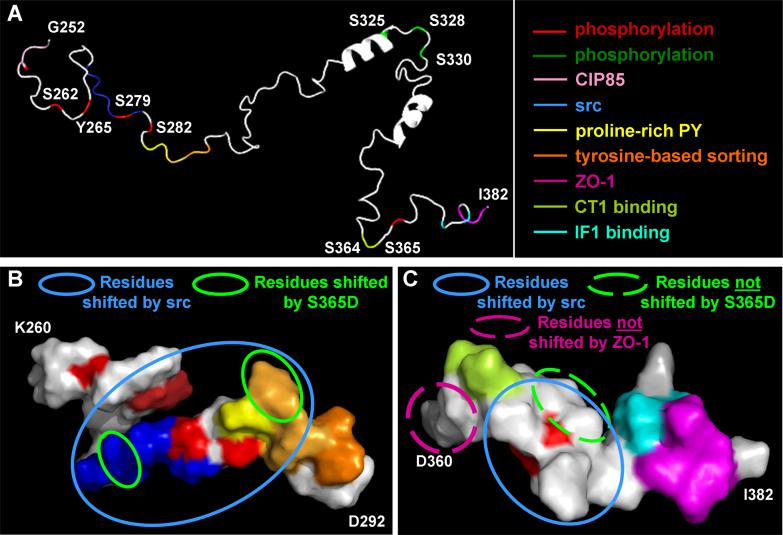
Figure 2. Model of the Cx43 C-terminus based on NMR structural studies.
(A) Cartoon of a possible structure for the Cx43 C-terminus (amino acids 252−382) with known regulatory sites/binding sequences marked in different colors produced using the PyMOL Molecular Graphics System (http://www.pymol.org). (B and C) Space filled models of amino acids 260−292 and 360−382, respectively. Circles mark residues which show resonance peak shifts in NMR spectra in response to SH3 binding (B) or S365D substitution (C). Blue circles mark residues that shift in response binding of the src SH3 domain (B and C). Green circles mark residues that are shifted in a S365D mutant as compared to wild type (B). In (C) dashed lines represent the only residues shown that do not shift due to ZO-1 binding (pink) or the S365D mutation (yellow).

