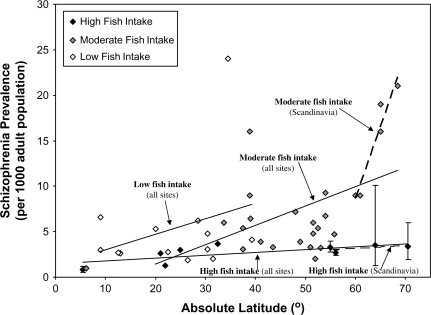
Fig. 2.
Schizophrenia Prevalence and Latitude by Fish Intake.
Note: Error bars represent 95% confidence limits. The slopes of linear regression lines were 0.03 for sites with high fish intake, 0.21 for sites with moderate fish intake, and 0.17 for sites with low fish intake. For the subset of Scandinavian sites, the slope of linear regression for was 0.03 for sites with high fish intake and 1.57 for sites with moderate fish intake.

