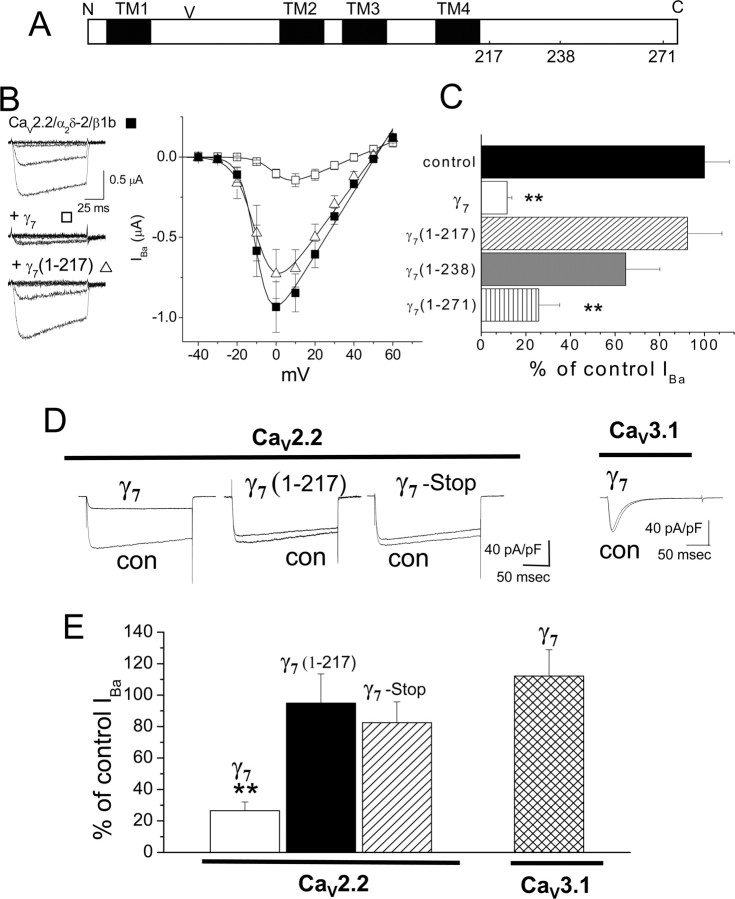
Figure 1.
Effect of C-terminal truncation of γ7 on CaV2.2/β1b/α2δ-2 and CaV3.1 currents. A, Linearized diagram of γ7, indicating the approximate positions of the four transmembrane (TM) segments (black bars), the N-glycosylation site (V) at N45, and the position of the truncations at amino acids 217, 238, and 271. B, Left, Example traces elicited after cDNA injection into Xenopus oocytes by 100 ms step depolarizations to between −40 and 0 mV from a holding potential of −100 mV for CaV2.2/β1b/α2δ-2 (top), plus γ7 (middle) and plus γ7 (1–217) (bottom). The charge carrier was 10 mm Ba2+. The symbols beside the traces refer to the relevant data in the current–voltage relationship (right); CaV2.2/β1b/α2δ-2 (■; n = 19) plus γ7(1–217) (▵; n = 18) and plus γ7 (□; n = 8). Data are fit by a modified Boltzmann function as described in Materials and Methods, with V 50, act of −9.9, −9.8, and +1.2 mV, respectively, and G max of 19.6, 16.6, and 5.9 μS, respectively. C, Mean percentage of control peak I Ba for CaV2.2/β1b/α2δ-2 currents (black bar; n = 29) when coexpressed with γ7 (white bar; n = 31) or its truncated constructs, γ7(1–217) (hatched bar; n = 15), γ7(1–238) (gray bar; n = 12), and γ7(1–271) (striped bar; n = 16). The statistical significances compared with control are **p < 0.01. There was no effect of any of the constructs on the voltage for 50% steady-state inactivation, which from combined experiments was −60.2 ± 0.8 mV for controls (n = 16), −58.6 ± 1.0 mV in the presence of γ7 (n = 7), −61.7 ± 3.6 mV for γ7(1–217) (n = 5), and −59.8 ± 1.0 mV for γ7(1–271) (n = 5). D, Representative traces of peak Ba2+ currents in tsA 201 cells, cotransfected with CaV2.2, β1b and α2δ-2 with pMT2 as control (con) compared with γ7 (panel 1), γ7(1–217) (panel 2), and γ7(stop) (panel 3). Panel 4 shows CaV3.1 expression with pMT2 as control (con) compared with γ7. Currents were elicited by depolarization to +5 mV (CaV2.2, 1 mm Ba2+) or −10 mV (CaV3.1, 10 mm Ba2+), from a holding potential of −100 mV. Calibration bars refer to all traces for CaV2.2. E, Mean inhibition of Ba2+ currents (expressed as percentage of control ± SEM) induced by coexpression of CaV2.2 with γ7 (white bar; n = 21), γ7(1–217) (black bar; n = 15), γ7(stop) (hatched bar; n = 28), or CaV3.1 with γ7 (cross-hatched bar; n = 29). Statistical significance compared with the current size without γ7, **p < 0.01, Student's t test.

