
Figure 7.
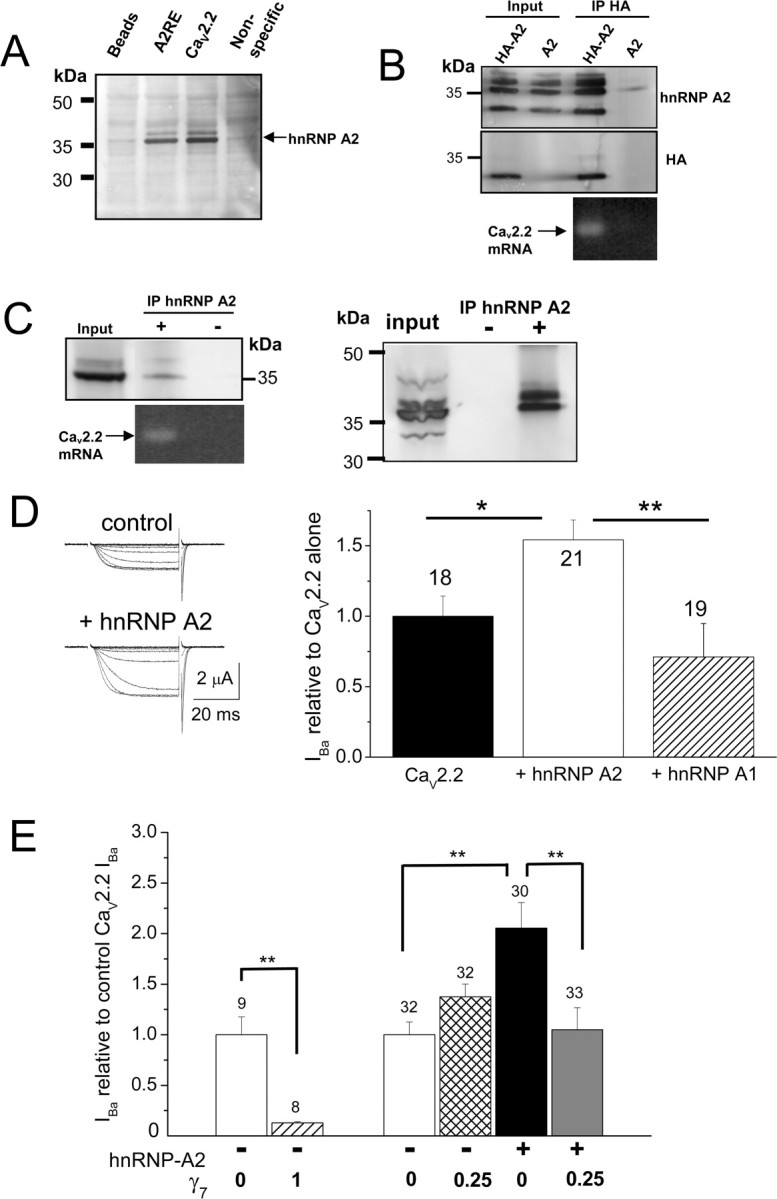
Binding of hnRNP A2 to CaV2.2 mRNA and effect of hnRNP A2 and γ7 on CaV2.2 currents. A, Evidence that one of the two potential A2RE sites in CaV2.2 mRNA binds to hnRNP A2. Endogenous hnRNP A2 (indicated by the arrow) from mouse brain lysate was pulled down by biotinylated oligonucleotides containing the consensus A2RE site (lane 2) and the potential site in CaV2.2 (lane 3) but not by beads alone (lane 1) or by a nonspecific sequence with the same composition as the consensus A2RE site (lane 4). The hnRNP A2 was detected by immunoblotting with anti-hnRNP A2 Ab (F16). Position of molecular weight markers is shown on the left. Representative of two experiments. B, Coimmunoprecipitation of endogenous CaV2.2 mRNA associated with hnRNP A2 in PC12 cells. Two days after transfection with HA–hnRNP A2 (HA-A2, lanes 1 and 3) or hnRNP A2 (A2, lanes 2 and 4), hnRNP A2 protein was immunoprecipitated (IP) from the whole-cell lysate (lanes 1 and 2) with HA antibody (lanes 3 and 4). Immunoblots show that HA Ab pulled down hnRNP A2 [top row, anti-hnRNP A2 (EF-67 Ab); middle row, anti-HA]. Coimmunoprecipitated RNA was extracted, reverse transcribed, and amplified by PCR. A specific PCR product corresponding to the endogenous CaV2.2 mRNA was amplified (35 cycles) only in the condition in which hnRNP A2 protein was pulled down (bottom row, lane 3). C, Left, Endogenous hnRNP A2 proteins were immunoprecipitated from PC12 cells with anti-hnRNP A2 Ab EF-67 (top row, lane 2). In this condition, a specific PCR product corresponding to the endogenous CaV2.2 mRNA was also amplified (35 cycles, bottom row). CaV2.2 mRNA was not detected in the control in which antibody was omitted (lane 3). Right, The immunoprecipitation was repeated, including an acetone precipitation step, to confirm the presence of endogenous hnRNP A2. D, Enhancement by hnRNP A2 but not hnRNP A1 of CaV2.2 currents recorded from Xenopus oocytes. Left, Example traces elicited by 50 ms step depolarizations to between −40 and 0 mV in 10 mV steps, from a holding potential of −100 mV for CaV2.2/β1b/α2δ-2 (top traces) or CaV2.2/β1b/α2δ-2 plus hnRNP A2 (bottom traces). The charge carrier was 10 mm Ba2+. Right, Bar chart shows the effect of hnRNP A2 coexpression with CaV2.2/β1b/α2δ-2 on peak CaV2.2 I Ba amplitude, expressed relative to the mean peak control current in each experiment. Control (black bar; n = 18), for both groups taken from experiments directly comparing hnRNP A1 and hnRNP A2: + hnRNP A2 (white bar; n = 21) and + hnRNP A1 (hatched bar; n = 19). These data are pooled from two separate experiments showing similar results. Statistical significance, *p < 0.05, **p < 0.01 (one-way ANOVA and Bonferroni's post hoc test). E, Inhibition of the hnRNP A2-mediated enhancement of I Ba in Xenopus oocytes by a low concentration of γ7. Bar chart compares the effect of two concentrations of γ7 cDNA (γ7: CaV2.2 ratio 1 and 0.25) and also shows the lack of enhancement by hnRNP A2 on peak CaV2.2 I Ba amplitude, when coexpressed with the lower concentration of γ7 (γ7: CaV2.2 ratio 0.25). Data are expressed as a percentage of the mean peak control CaV2.2 current in each experiment, and all data were recorded 2 d after cDNA injection. Control in the absence of γ7 or hnRNP A2 (white bars); + γ7 (ratio 1; hatched bar), + γ7 (ratio 0.25; cross-hatched bar), + hnRNP A2 (black bar, from data obtained in the same experiments), + hnRNP A2 and γ7 (ratio 0.25; gray bar). Number of determinations given above each bar. These data are pooled from five different batches of oocytes, in all of which similar results were observed. Statistical significance, **p < 0.01 (one-way ANOVA and Bonferroni's post hoc test).