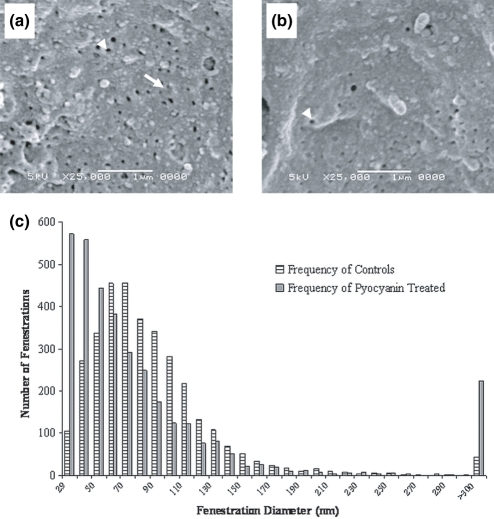
Figure 2.
Scanning electron microscopy of liver sinusoids from control and pyocyanin-treated rats. The fenestrations of the control liver sinusoid (a) are larger in diameter and higher in frequency (number of fenestrations per μm2) than those of the pyocyanin-treated liver (b). The arrow-head indicates a single fenestration and the full arrow, a sieve-plate circumscribing many fenestrations. Original magnification 25,000×, scale bar = 1 μm. (c) is a histogram of fenestration diameters measured on scanning electron micrographs, showing a lower proportion of smaller fenestrations in pyocyanin-treated liver endothelium than in control livers. There was a non-significant trend towards an increased number of gaps (>300 nm) with pyocyanin treatment.

