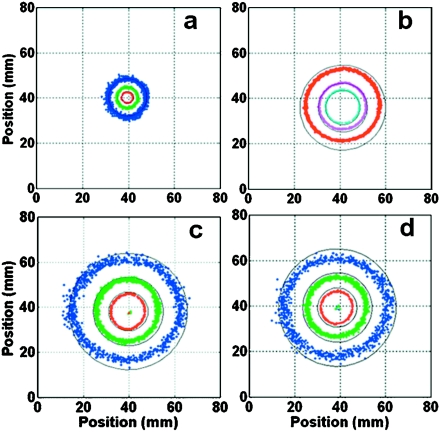
Figure 6.
Theoretical (solid, black) and experimental (color, dotted) absolute SNR (ml−1 Hz1∕2) in the plane of the whip junction of the semi-rigid minimal-loss antennae in the 0.35% saline. (a) The 1.5 T antenna made with λc∕4 cable. (b) The 4.7 T antenna made with λc∕4 cable. (c) The 3 T antenna made with λc∕4 and (d) 3λc∕4 cables. The experimental SNR data (blue, 50 000; green, 100 000; red, 200 000; purple, 400 000; cyan, 800 000 ml−1 Hz1∕2) overlap the continuous circular theoretical contours corresponding to the same values. Contributions from the system noise (NF) are subtracted from the experimental data. Theoretical and mean experimental SNR values at a specific location differ by <10% in all cases.

