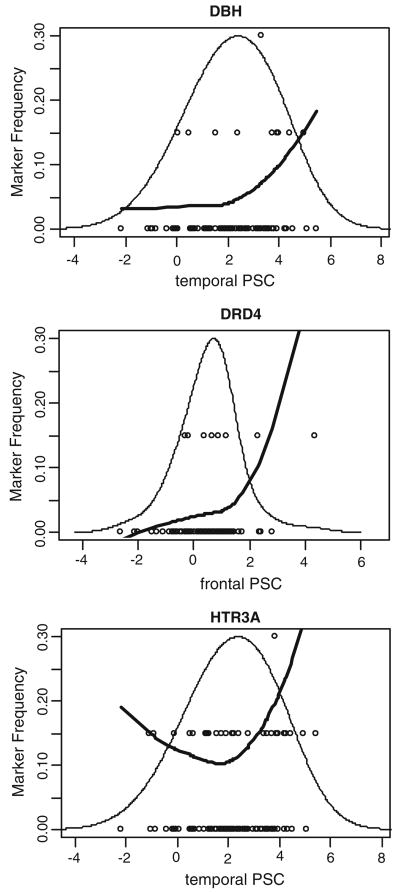
FIGURE 3.
Physiogenomic representation of significant physiogenomic associations. Individual subject genotypes (circles) of each SNP are overlaid on the distribution of PSC (thin line). Each circle represents a subject, with the horizontal axis specifying the local neuronal activity, and the vertical axis the carrier status for the minor allele: bottom, non-carriers; middle, single-carriers; top, double-carriers. A LOESS fit of the allele frequency (thick line) as a function of PSC is shown. The ordinate is labeled for the marker frequency (thick line) of the SNP denoted at the top of each panel. The ordinate scale is the same in all three panels. The ordinate scales for the genotypes (circles) and PSC distribution (thin line) are not shown. The abscissa is labeled for neuronal activity in each panel. The abscissa scale is the same in all three panels and applies identically to marker frequency, genotypes, and neuronal activity.

