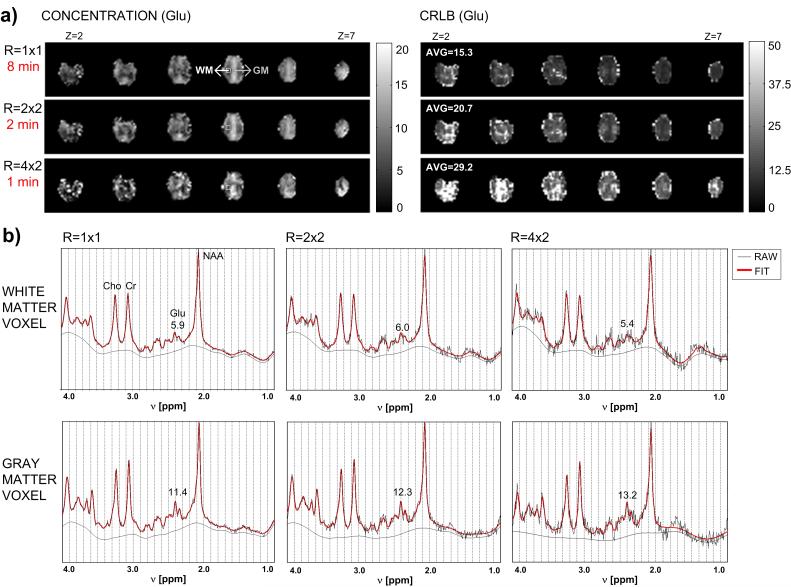
Figure 3.
a) 3-D spatial chemical concentration maps and Cramer-Rao lower bound (CRLB) maps for Glutamate (Glu) at different acquisition times using SENSE to reduce the number of phase-encoding steps. CRLB is the error term resulting from spectral fitting to the LC apriori model used to determine chemical concentration. b) Raw absorption mode spectrum (black line) and corresponding LCModel fit (red line) for a gray matter (GM) voxel and a white matter (WM) voxel (voxel locations are indicated in part a). The remaining baseline is given by the smooth black curve. The concentration of Glutamate is given in each example. (Figure provided by Dr. Ricardo Otazo)

