
Figure 5.
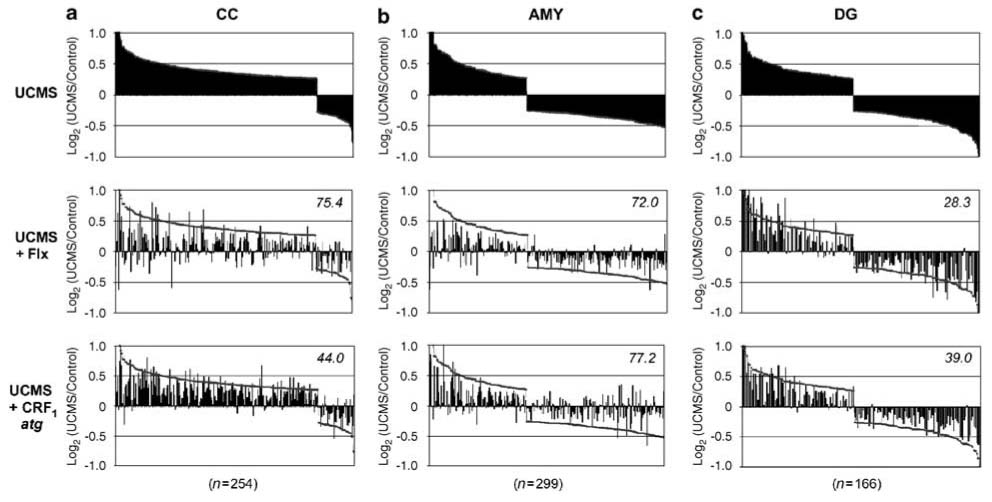
Differential reversal of the UCMS gene expression profiles by antidepressant treatments. Profiles of changes in gene transcript levels for UCMS-affected genes (top panels) and after reversal by antidepressant treatments (middle and low panels) in CC (a), AMY (b), and DG (c). Selected gene groups are from Figure 3. Top panels: UCMS-affected genes are organized by the magnitude of their changes in transcript levels along the x axis and form a continuous profile with a pre-determined 20% effect cutoff value (see Materials and methods). Vertical bars indicate the amplitude of changes (log2 of UCMS/control expression ratio). Middle and low panels: vertical bars indicate the relative transcript levels for the same UCMS-affected genes after chronic fluoxetine or SSR125543 treatment. Note that the profiles have shifted away from UCMS levels (black contour line), back toward control ‘no change’ levels (log2r~0). The average percentage of drug reversal of the UCMS molecular profile is indicated per brain area and drug treatment. Flx, fluoxetine; CRF1atg, SSR125543.