
Figure 9.
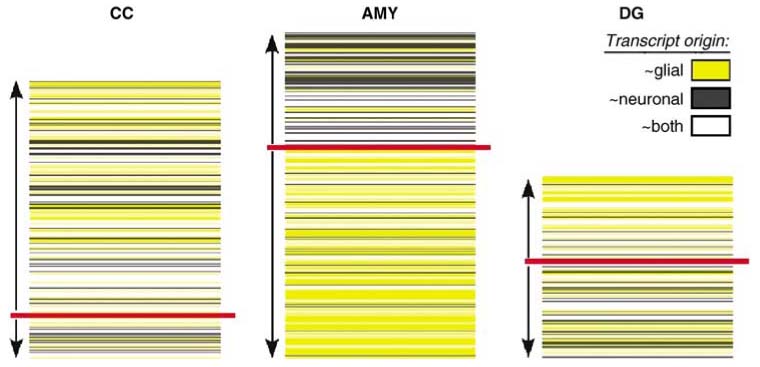
Glial/neuronal enrichment of altered gene expression in three brain areas in the UCMS model. Transcripts in CC (n=254), AMY (n=299), and DG (n=166) are organized vertically according to the extent of altered gene expression. Up and down arrows indicate up- and downregulation of gene transcripts in the UCMS model. Color overlay indicates the cellular origin of the transcript: yellow ~glial origin (WM/GM>1.5), gray ~ neuronal origin (−1.5<WM/GM), and white ~both cellular populations (−1.5<WM/GM<1.5) (Sibille et al, 2008). Note the apparent increased representation of glial expression in downregulated genes in AMY. Red bar separates up- from downregulated genes.