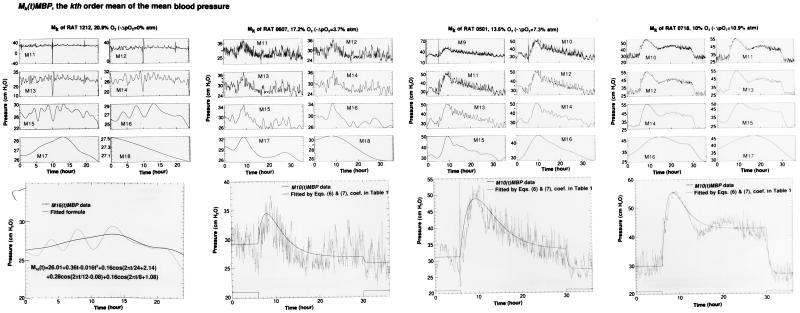
Figure 2.
Mean trends of the MBP and their analytical expressions. Mk(t)MBP is the mean trend of order k, a function representing the MBP history. The highest order, Mn(t), has no oscillations. The number n is data specific. Mk(t)MBP with k < n contains oscillations of various degree (see Eq. 4). (Upper) Mk(t) for various values of k. (Lower) One example at a larger scale and the curve fitting by Eqs. 6 and 7 is illustrated. The coefficients of the fitted curves are listed in Table 1 except for the case of rat no. 1212, which was not subjected to hypoxia. For the normal rat 1212, the mean trends of order 16 and the analytic approximation of M16(t) are shown in the lowest left panel.

