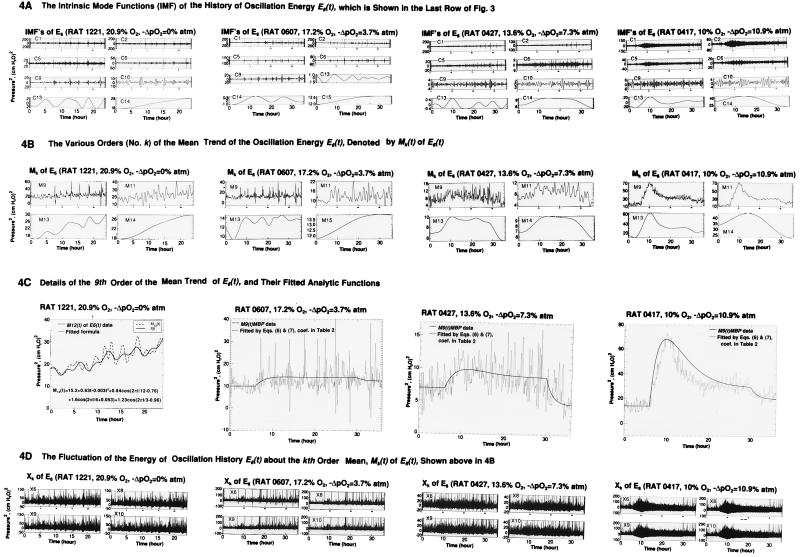
Figure 4.
Analysis of the energy of oscillations E6(t), which is a stochastic signal with its own IMFs (shown in A), Mk(t)s (shown in B), and Xk(t)s. In C and D, Mk(t) of E6(t) and Xk(t) of E6(t) are shown for k = 12 and 9, respectively. They are fitted with analytic functions as in Eqs. 6 and 7. The coefficients of the fitted curves are given in Table 2, except for the normal rat 1221, whose results are shown in C.

