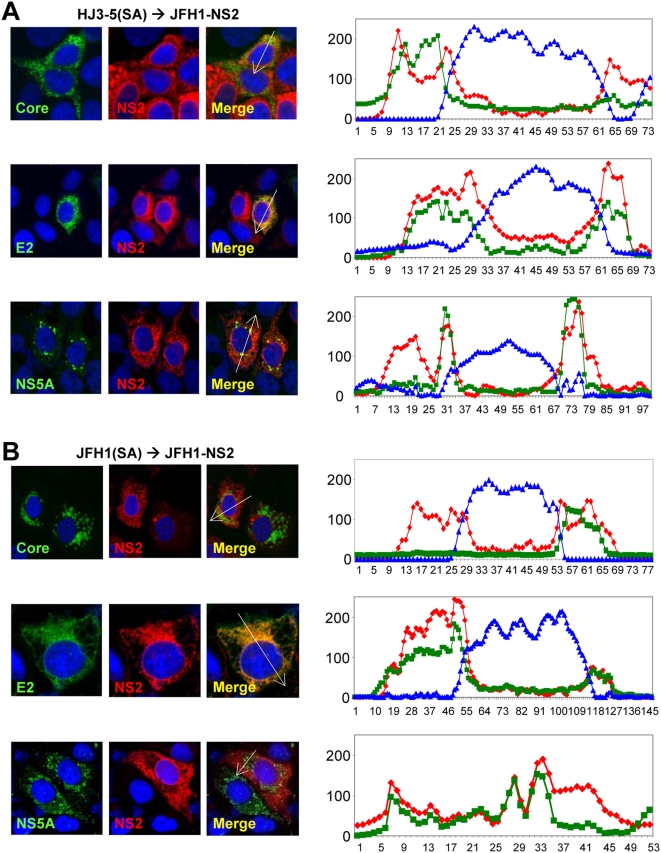
Figure 8. Confocal microscopic imaging of intracellular NS2 distribution.
NS2 protein co-localizes with E2 but not core protein. VEE replicon cells expressing FlagJFH1-NS2 were transfected with (A) HJ3-5(SA) or (B) JFH1(SA) RNA and fixed and labeled two days later with antibodies specific for core protein (green, upper panel), E2 (green, middle panel), NS5A (green, lower panel), or NS2 (red). Slides were subsequently examined with a Zeiss LSM 510 Meta microscope. At the right are line scan results obtained using MetaMorph software depicting a linear trace of the fluorescence intensity of individual pixels along a segment of the white arrow overlaying the merged image. The Y axis represents average pixel intensity while the X axis represents distance from the origin. Red, green, and blue traces correspond to the color of the fluorophores shown in merged images. This analysis revealed a high level of colocalization between NS2 and E2, but only partial colocalization of NS2 and NS5A.

