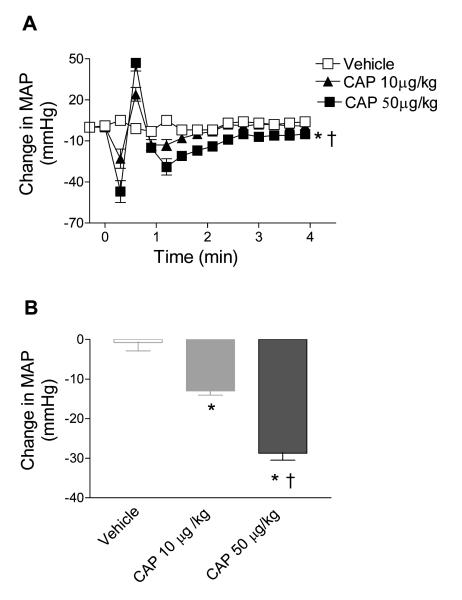
Figure 1.
A, Time-dependent responses of MAP to bolus injection of vehicle or CAP (10 μg/kg; 50 μg/kg). B, Changes in MAP 70 seconds after bolus injection of vehicle or CAP (10 μg/kg; 50 μg/kg). Values are mean±SE (the same for all data presented below; n = 6 to 7). *P<0.05 compared to corresponding vehicles. †P<0.05 compared to rats treated with CAP (10 μg/kg).

