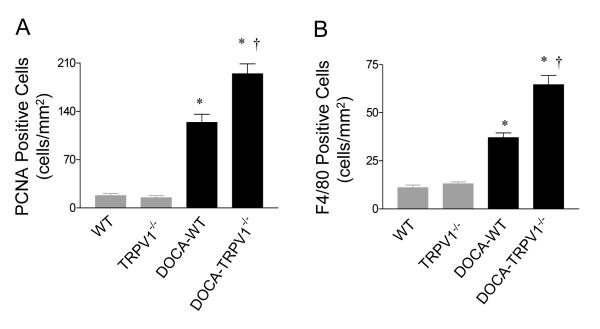
Figure 4.
Effect of deoxycorticosterone acetate (DOCA)-salt treatment on renal cortex cell proliferation and monocyte/macrophage infiltration in wild type (WT) and TRPV1-null mutant (TRPV1-/-) mice. A: Graph presenting the mean value of PCNA-positive cells in the renal cortex. B: Graph presenting F4/80-positive cells (monocyte/macrophage) in the renal cortex. The results are expressed as cells per square millimeter. Values are mean ± SE (n=7 to 8). *P<0.05 compared with control WT or TRPV1-/- mice; †P<0.05 compared with DOCA-salt-treated WT mice.

