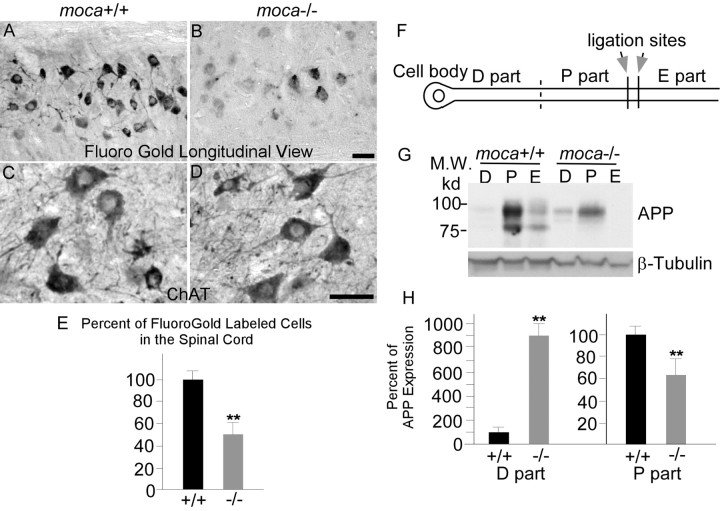
Figure 6.
A–H, Impaired axonal transport in moca−/− mice. Longitudinal views of fluorogold labeling in the lumbar 5 region of spinal cord of control (A) and moca−/− (B) mice at the age of 12 months. C, D, ChAT staining of the cross-sections of spinal cord of control (C) and moca−/− (D) mice. The percentage change of fluorogold labeling was quantified and represented in E. The fluorogold-labeled cells for each mouse group are shown as the mean ± SD. Statistical analysis was done by a Student's t test (n = 6, **p < 0.01). F, G, Schematic presentation of sciatic nerve ligation (F) and the APP expression levels of different parts in the axon (G). The ligation sites are indicated by arrows. The proximal (P part) and distal (D part) segments (on the cell body end) relative to the ligation sites, and the remaining distal site (toward the cell body end; E part) were collected for Western blot analysis after the surgery. The levels of APP in each axonal part were analyzed by using 22C11 antibody. H, The percentage of APP expression in the proximal (P part) and distal (D part) segments relative to the controls of similar segments of wild-type animals was quantified by NIH Image tools and the statistics were performed by a Student's t test. The data are presented as mean ± SD (n = 6, **p < 0.01). Scale bar, 50 μm.

