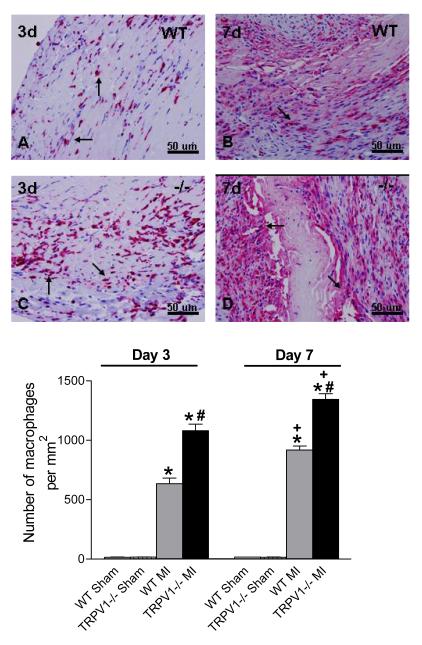
Figure 5.
Macrophage infiltration in the peri-infarct zone. Upper panel: Macrophage per high-power filed in the border zone (x 400, red-stained cells, arrow). Lower panel: Number of macrophages per square millimeter. N=8-9, *P<0.05 vs corresponding WT; †P<0.05 vs. WT at the same time point; ‡P<0.05 vs. corresponding day 3.

