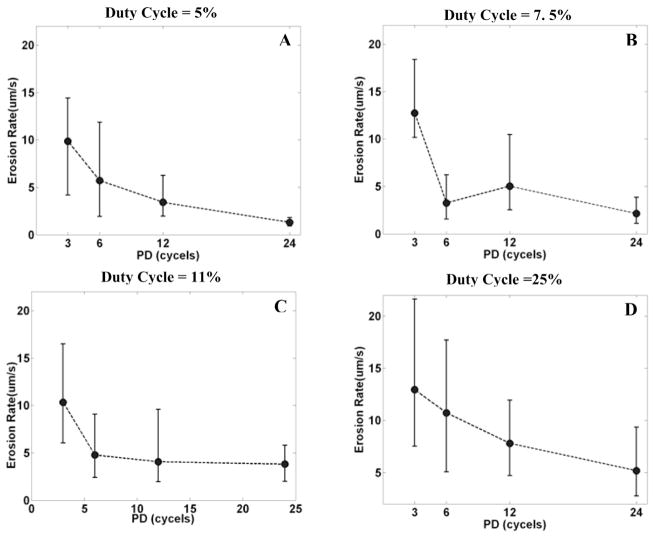
Fig. 8.
The relationship between the erosion rate and PD for a fixed duty cycle. In panels A, B, C, and D, the erosion rate was plotted versus PD by median and range values (min. and max.) for N = 8, corresponding to duty cycles of 5%, 7.5%, 11%, and 25%, respectively. In panel A, with a 5% duty cycle, the median erosion rate is 10.54 μm/s for a PD of 3 cycles and 1.23 μm/s for a PD of 24 cycles, approximately an 8-fold difference. In panel B, with a 7.5% duty cycle, the median erosion rate is 12.10 μm/s for a PD of 3 cycles and 2.01 μm/s for a PD of 24 cycles, approximately a 6-fold difference.

