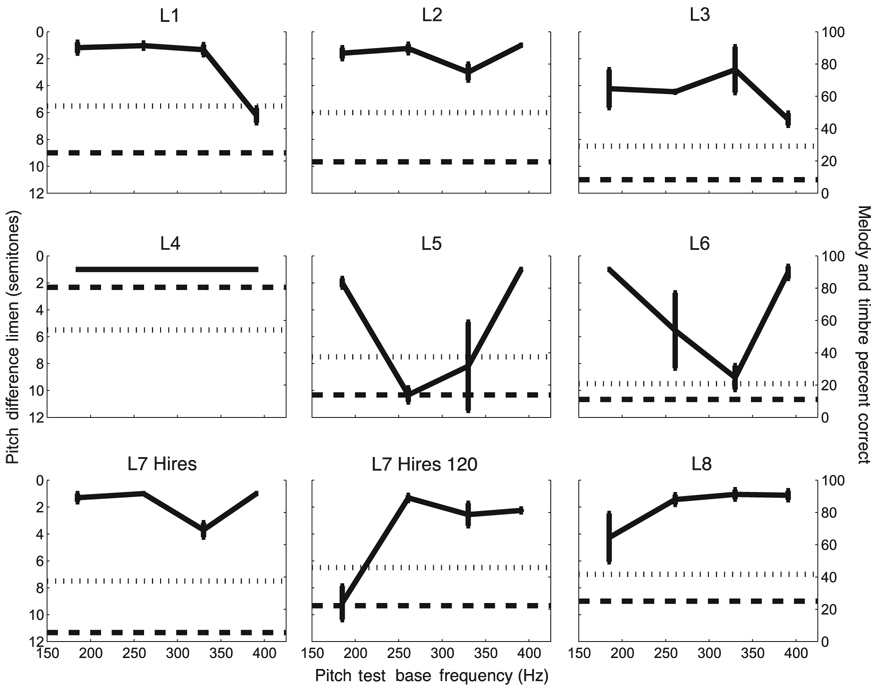
FIG. 4.
Graphs showing pitch scores (solid line with standard error bars) for each listener, overlaid with their melody (long hash line) and timbre test (short hash line) results. Note that the pitch score axis is inverted such that a smaller DL, which corresponds to a better score, is located higher on the graph.

