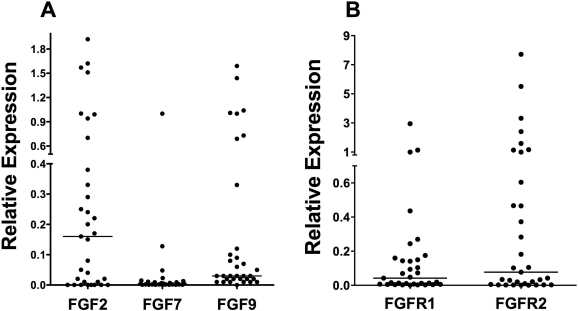
Fig. 1.
Expression of FGFs and FGFRs in NSCLC cell lines. Total RNA prepared from a panel of 33 NSCLC cell lines was reverse-transcribed and submitted to quantitative RT-PCR with primers (see Table 1) specific for FGF2, FGF7, or FGF9 (A) or FGFR1 or FGFR2 (B). The values are normalized to GAPDH mRNA measured in replicate samples and presented as relative expression. The horizontal bars denote the median expression among the 33 NSCLC cell lines.

