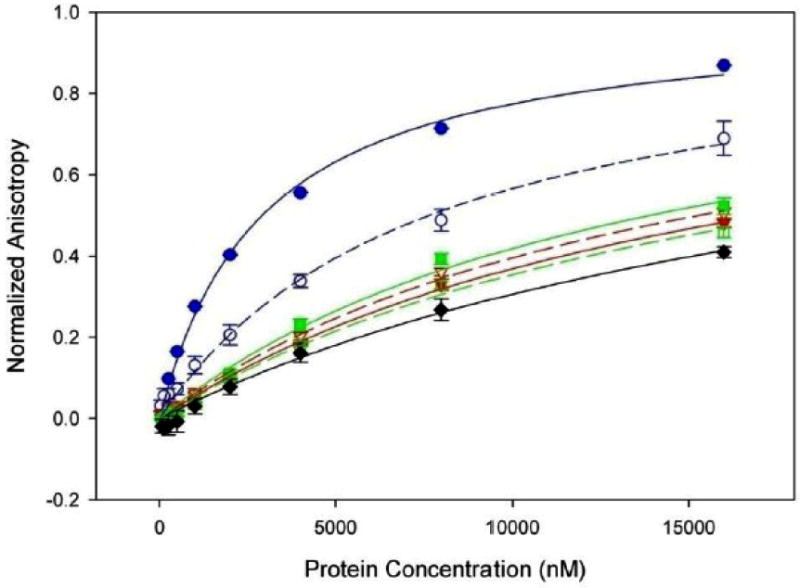
Figure 7.

Binding of ssDNA by the TraI C-terminus measured by fluorescence anisotropy. TraI 1476-1756 at 75 and 150 mM NaCl is indicated by solid and dashed blue lines (Kd =2.9 μM and Kd =7.7 μM) respectively. TraI 1476-1756 with a deletion of the proline rich loop at 75 and 150 mM NaCl is indicated by solid and dashed red lines (Kd >17.1 μM and Kd >15.9 μM) respectively. TraI 1476-1756 with mutations of prolines 1518, 1523 and 1525 to glycine at 75 and 150 mM NaCl is indicated by solid and dashed green lines (Kd >13.9 μM and Kd >18.2 μM) respectively, while the binding of 1476-1630 at 150 mM NaCl is indicated in black (Kd >22.6μM).
