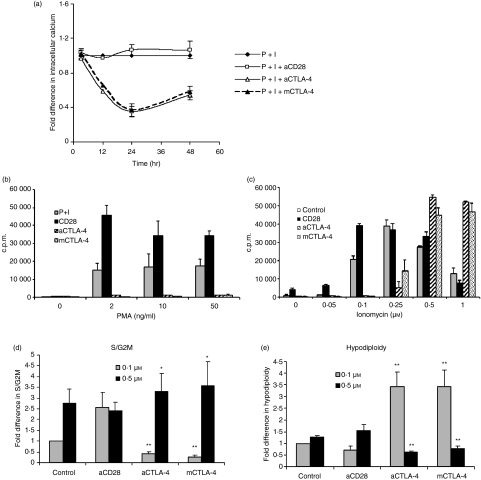
Figure 1.
The intracellular Ca2+ concentration ([Ca2+]i) is modulated by cytotoxic T-lymphocyte antigen (CTLA)-4–CD80/CD86 interactions in CD4+ T cells activated with phorbol 12-myristate 13-acetate (PMA) + Ionomycin (I). (a) CD4+ T cells were activated with 10 ng/ml PMA + 0·1 μm I in the presence or absence of anti-CD28, anti-CTLA-4 or mouse CTLA-4. At different times after activation, [Ca2+]i was measured using fluro-3 acetoxymethyl ester (Fluo-3AM). The mean fluorescence intensities (MFIs) obtained for different conditions were normalized to the MFI of cells activated with just PMA + I, which was taken as unity. Data shown are the mean ± standard error (SE) for three independent experiments. (b–e) Next, CD4+ T cells were activated with I (0·1 μm) plus the indicated concentrations of PMA (b) or 10 ng/ml PMA plus the indicated concentrations of I (c) in the presence or absence of anti-CD28, anti-CTLA-4 or mCTLA-4, and [3H]thymidine incorporation was measured. Cells activated with 10 ng/ml PMA plus 0·1 or 0·5 μm I in the presence of the indicated reagents were permeabilized and stained with propidium iodide after 48 hr of culture. The percentage of cells in the S/G2M and hypodiploid phases was determined by flow cytometry. Fold differences in percentages of S/G2M (d) and hypodiploid cells (e) under different activation conditions were normalized to that of cells activated with PMA + I (0·1 μm) alone, which was taken as unity. Data shown are the mean ± SE for three independent experiments. *P < 0·1; **P < 0·05. c.p.m., counts per minute.

