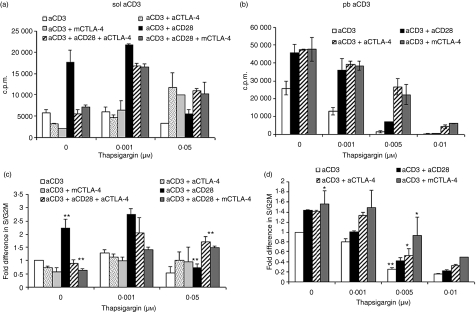
Figure 6.
Increasing intracellular Ca2+ concentration ([Ca2+]i) changes the strength of signal (SOS) and the profile of cytotoxic T-lymphocyte antigen (CTLA)-4 interactions. Increasing concentrations of Thapsigargin (TG) were added to soluble anti-CD3 (sol aCD3) or plate-bound anti-CD3 (pb aCD3) in the absence and presence of anti-CD28, anti-CTLA-4 or mouse CTLA-4. Proliferation was measured by [3H]thymidine incorporation (a) to cells activated with sol aCD3 and (b) to cells activated with pb aCD3. Also, at the end of 48 hr, cells were stained with propidium iodide and the percentage of cells in the S/G2M phase was determined by flow cytometry. The percentages were normalized to that of cells activated with just sol aCD3 or pb aCD3 and fold differences are shown in (c) and (d). The left-hand panel shows data for sol aCD3 and the right-hand panel data for pb aCD3 activation. *P < 0·1; ***P < 0·05. c.p.m., counts per minute.

