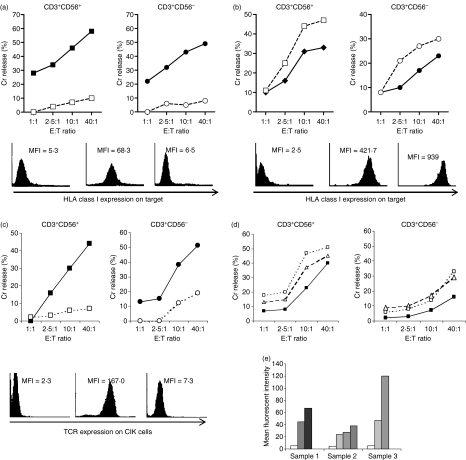
Figure 2.
(a) Cytotoxicity of purified CD3+ CD56+ (▀) and CD3+ CD56− cells (•) against acute myeloid leukaemia (AML) targets were abrogated when the human leucocyte antigen (HLA) class I molecules on the target cells were blocked by the W6/32 monoclonal antibody (mAb; □,○). Figure shows one representative assay. Eight comparison sets were performed for the CD3+ CD56+ subset, P < 0·05 in seven out of eight sets. Eight comparison sets were performed for the CD3+ CD56− subset, P < 0·05 for all eight sets. Histograms show isotype control (left) and HLA class I expression on blasts without (middle) and with W6/32 blocking (right) respectively, of one representative assay. (b) Cytotoxicity of the CD3+ CD56+ cells (▀) and CD3+ CD56− cells (•) was enhanced when HLA class I molecules on the AML target cells were up-regulated by preincubation with interferon-γ (IFN-γ; □ and ○, respectively). Figure shows one representative assay of two comparison sets carried out for both CD3+ CD56+ and CD3+ CD56− subsets, P < 0·05 for both. Histograms show isotype control (left) and HLA class I expression on blasts without (middle) and with preincubation with IFN-γ (right) respectively, of one representative assay. (c) Cytotoxicity of the CD3+ CD56+ cells (▀) and CD3+ CD56− cells (•) was inhibited when the CD3/T-cell receptor (TCR) complexes on the effector cells were blocked by a TCR-blocking mAb T10B9. The figure shows one representative assay. Four comparison sets were made for the CD3+ CD56+ subset, P < 0·05 in three out of four sets. Four comparison sets were made for the CD3+ CD56− subset, P < 0·05 for all. Histograms show isotype control (left) and TCR expression on cytokine-induced killer cells without (middle) and with T10B9 blocking (right) respectively, of one representative assay. (d) Cytotoxicity of the CD3+ CD56+ cells (▀) and CD3+ CD56− cells (•) was enhanced when the CD3/TCR complexes on the effector cells were either stimulated with OKT3 (Δ) or with a stimulating anti-TCR mAb (□). Two comparison sets were carried out for the CD3+ CD56+ subset and three comparison sets for the CD3+ CD56− subset, P < 0.05 for all. (e) Mean fluorescent intensity of degranulation marker CD107a over time after ligation with OKT3. There were three samples at serial time-points: 0 min (□), 30 min ( ), 60 min (
 ), 120 min (
 ), 240 min (▀).

