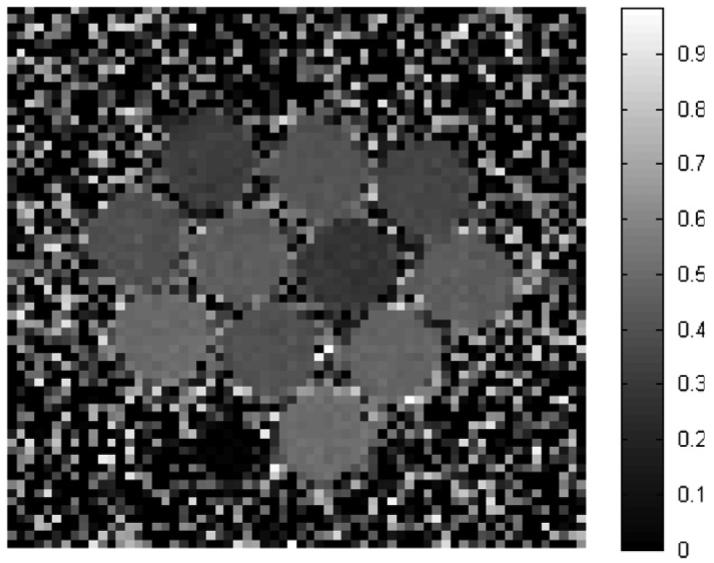
Figure 1.

Example MTP image for the MAGIC-2 dosimeter, acquired at 8.88 μT calculated from images acquired at 200 000 and 1375 Hz off-resonance. The dose values are, beginning at the top left and reading left to right, (row 1) 2, 10, 4 Gy; (row 2) 6, 12, 9, 14 Gy; (row 3) 18, 8, 16 Gy and (row 4) 20 Gy. The dark space to the left of the 20 Gy dosimeter is a small vial of water used for location reference purposes.
