
Figure 2.
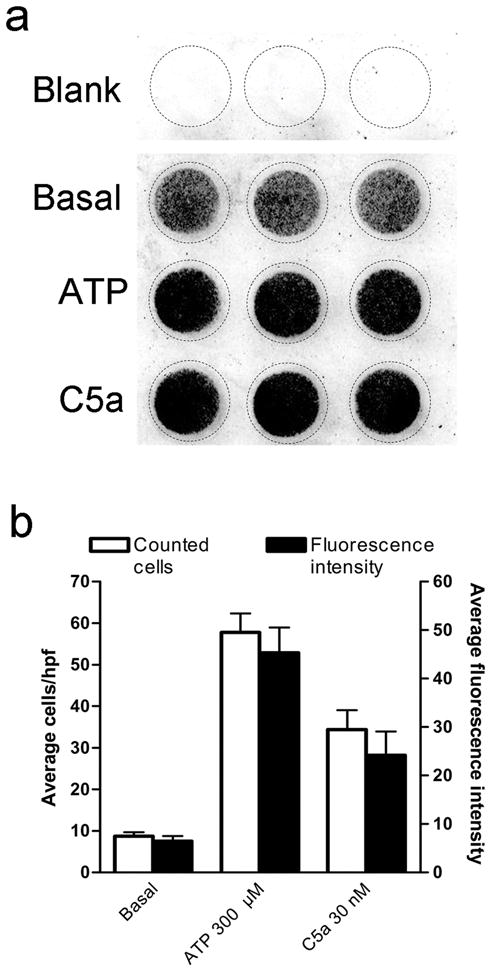
Quantification of migration by near-infrared fluorescence. (a) A representative scan of fluorescence (converted to grayscale) depicting background fluorescence (blank), basal migration (vehicle), ATP- and C5a-stimulated migration. (b) Comparison of manual cell counting in randomly selected high power fields (hpf) (open bars) to fluorescence signal (filled bars) for basal, ATP (300 μM) and C5a (30 nM) stimulated migration. n=9 (i.e. 3 independent experiments performed in triplicate).