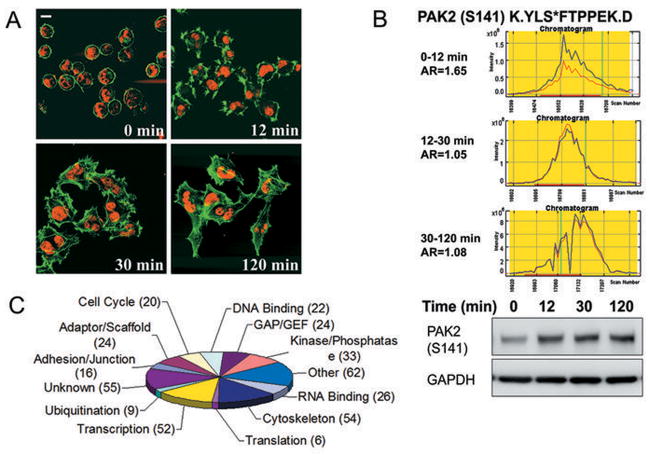
Figure 2.
MS data analyses of integrin phosphoproteomics. A, mass spectrometry experiment was designed based on the morphological changes of HeLa cells during adhesion to and spreading on type I collagen-coated surface. Cells expressing GFP-actin fusion protein (green) were fixed at the indicated times and stained with TO-PRO-3 iodide (red) for nuclei. B, phosphorylation status of S141 of PAK2 during the three indicated time points in chromatogram and in Western blot. AR is the ratio of the “light” peak area (blue) over the “heavy” peak area (red) in chromatogram. The phosphorylation of PAK2 at Serine 141 is detected by antibody against pS141-PAK2 in Western Blot. C, categorization of proteins according to biological activity. One protein may be involved in multiple activities.

