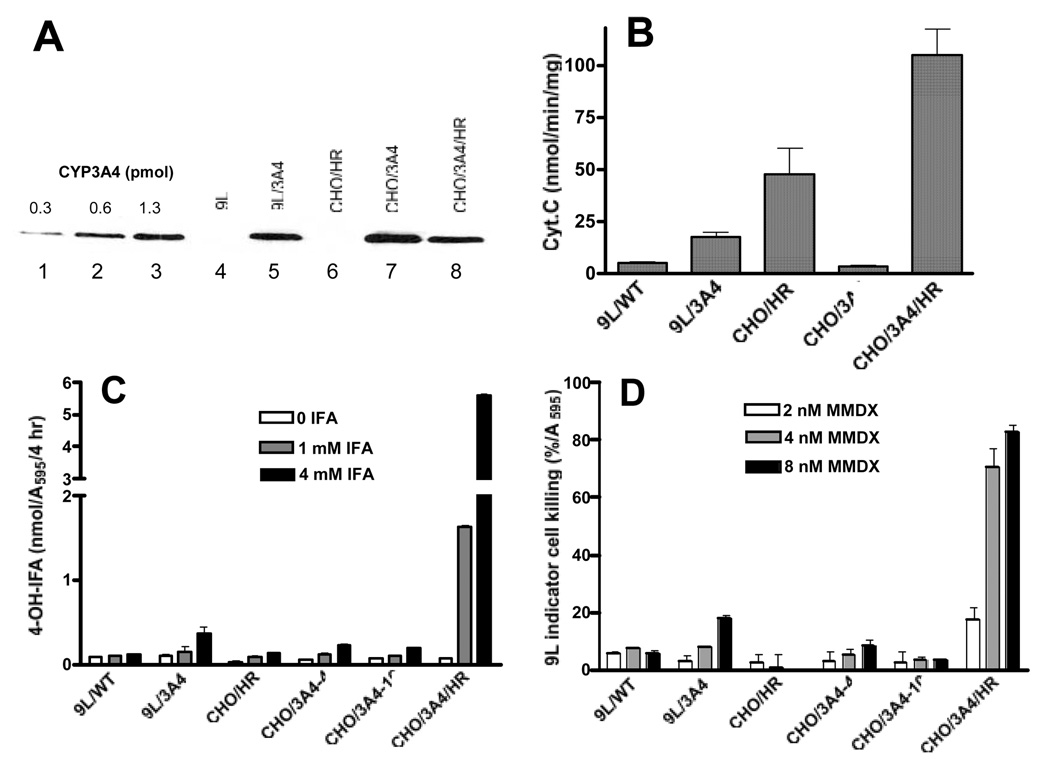
Fig. 2. Metabolic activation of IFA and MMDX by CHO and 9L cells expressing CYP3A4 and/or P450 reductase (HR).
A) Western blot of CYP3A4 protein levels in CYP3A4 standards (lanes 1–3) and in each of the indicated cell lines (lanes 4–8), and B) P450 reductase activity (cytochrome c reduction) were both determined in total cell lysates prepared from cells plated overnight in 6-well tissue culture plates at 300,000 cells/well, and collected in 0.2 ml of 50 µM KPi buffer pH 7.4 containing 0.1 mM EDTA and 20% glycerol, then lysed by sonication. C) 4-OH-IFA production by cultured cell lines. Cells were plated overnight in 12-well tissue culture plates at 150,000 cells/well and then incubated for 4 hr in 1.5 ml fresh medium containing 0, 1 or 4 mM IFA, plus 5 mM semicarbazide to stabilize the 4-hydroxy metabolite. An aliquot (0.5 ml) of culture medium was removed, derivatized, and assayed for 4-OH-IFA formation and for relative cell number (crystal violet staining, A595). Data shown are nmol 4-OH-IFA formed/A595 cells during the 4 hr incubation (mean ± range, n=2). D) Active MMDX metabolite formation, determined by the killing of 9L indicator cells in a 4 d growth inhibition assay. 9L indicator cells plated overnight at 3,000 cells/well in 96-well plate were incubated for 4 d with cultured supernatants from 9L, 9L/3A4 or CHO/HR, CHO/3A4, CHO/3A4/HR cells incubated for 2 hr with 2, 4 or 8 nM MMDX. 9L indicator cell killing expressed as a percentage of MMDX-free controls was determined by crystal violet staining (mean ± range, n=2). CHO/3A4-4 and CHO/3A4–10 correspond to two independent clones with similar CYP3A4 protein levels (not shown) and similar sensitivity to MMDX (see Table 1).

