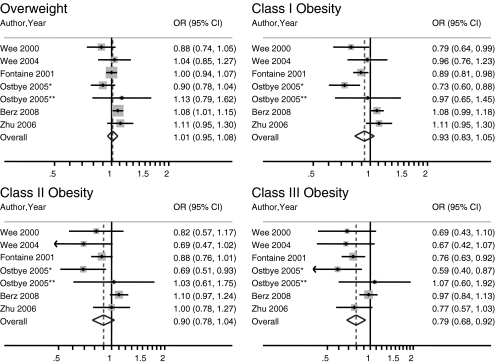
Figure 2.
Meta-analyses of nationally representative studies with BMI in five categories. Note: Included studies: 30–33,35,38; BMI categories: overweight 25–29.9 kg/m2, class I obesity 30–34.9 kg/m2, class II obesity 35–39.9 kg/m2, class III obesity ≥40 kg/m2. *Data from analysis of white women. **Data from analysis of black women. BMI, body mass index; OR, odds ratio; CI, confidence interval.

