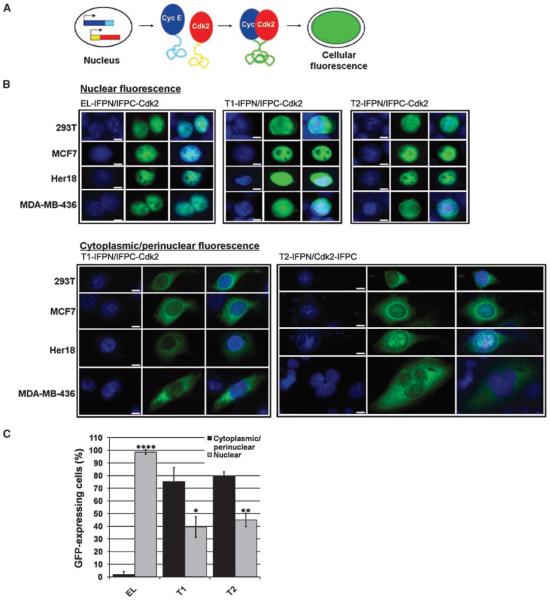
Figure 2. LMW-E/Cdk2 complexes are cytoplasmic.
A, the schematic shows the principle of protein complementation. Cyclin E/Cdk2 binding brings the IFP fragments into proximity, thereby emitting green fluorescence. B, cyclin E (EL, T1, or T2)-IFPN and IFPC-Cdk2 were coexpressed in various cell lines. Cells expressing nuclear (top) or cytoplasmic/perinuclear (bottom) green fluorescence are shown. Nuclei are 4′,6-diamidino-2-phenylindole(DAPI)–stained blue. Images were taken using the ×20 objective and merged. Scale bar, 5 μm. C, the bar graph shows the percentage of green fluorescent 293T cells that show cyclin E-IFPN/IFPC-Cdk2 signal in the cytoplasm/perinuclear membrane and the percentage of cells that show signal in the nucleus. A total of 606 ≤ n ≤ 767 green fluorescent cells over 5 to 10 microscopic fields were counted for each condition. The SD was calculated for three biological replicates. Student's t test was performed for cytoplasmic/perinuclear versus nuclear localization for each condition; P < 0.05 (*), P < 0.01 (**), and P < 0.0001 (****).

