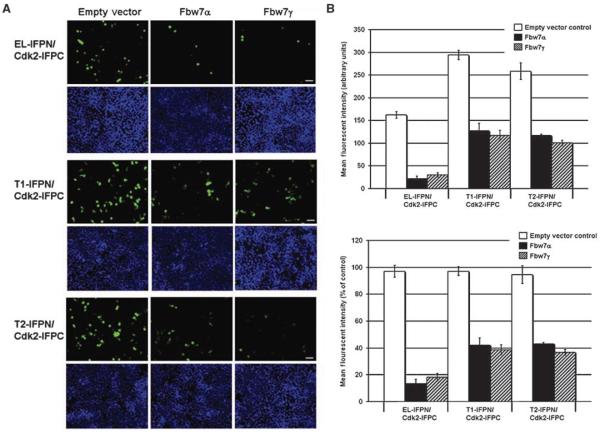
Figure 4. Fbw7 reduces cyclin E-IFPN/IFPC-Cdk2 complex formation.
A, 293T cells were cotransfected with cyclin E-IFPN and IFPC-Cdk2 in the absence or presence of Fbw7. Top, cells expressing green fluorescence. Blue DAPI-stained nuclei (bottom) are shown to show that each field has a comparable number of cells. Images were taken using the ×10 objective. Scale bar, 50 μm. B, FACS was used to measure IFP fluorescence in 293T cells. Top graph, mean fluorescent intensity; bottom graph, normalized to the empty vector controls. Columns, mean of three biological replicates, n = 30,000 cells per replicate analyzed by FACS; bars, SD.

